As part of viewing the average course grade in an interactive chart graph, you can use filters to compare section, student, and assignment results with the course average.
Only active and completed student enrollments are included in Course Analytics. Students who are dropped, deleted, or inactive will not appear in filtered data results.
Notes:
- If you cannot view the Course Analytics link in Course Navigation, you may have to make the link visible via the Navigation tab in Course Settings. If the Course Analytics link is not available in the Navigation tab, your institution has disabled this feature.
- Data is refreshed in Course Analytics every 8 hours. However, if Course Analytics was recently enabled in the course, it may take up to 24 hours for filtered analytics data to populate. Make sure to also check the time data was last updated in the course, as content may be outdated compared to recent course activity and student submissions.
- In order for Course Analytics to display in Canvas, third-party cookies may need to be enabled in your browser settings.
- Assignments without due dates are displayed at the far right of the chart graph.
00:07: How do I compare the course average chart graph with an assignment section or
00:11: student filter in new Analytics.
00:14: In global navigation, click the courses link.
00:18: Then click the name of the course.
00:21: To open new analytics. Click the new analytics Link in course, navigation.
00:27: Or click the new analytics button in the course homepage.
00:31: Click the course grade table.
00:34: Click, the filter field, type the name of a section student, or assignment
00:38: canvas will populate all matching results.
00:41: When the item displays in the menu, click the item name, You
00:46: can also click the filter field and use the scroll to locate and select a section
00:50: student or assignment.
00:53: To add another filter, locate the additional filter, the filter field
00:57: supports up to three filters. The all sections filter cannot be removed.
01:03: By default analytics selects all assignment types to display within the
01:07: page.
01:09: Each assignment in the chart displays the appropriate icon for each selected assignment
01:13: type.
01:15: To view additional assignments within the filtered results, click and drag the scroll
01:19: bar.
01:21: To filter by assignment. Type remove the checkbox next to the assignment type.
01:26: The chart dynamically updates, the results based on the assignment type selected
01:30: or removed in the filter.
01:33: The added filter displays in the analytics results, each filter is identified
01:38: by a specific color. Each filter displays as a data point within the table
01:43: When viewing filters, the default shape for each color is a circle, but you
01:47: can choose to enable shapes for improved contrast by clicking the chart options
01:51: icon and selecting the display shapes option.
01:55: To view data for a section, click the data point for the section,
02:00: In a section comparison details provided additional metrics for the section
02:04: named assignment. Name. Assignment, due date, average grade
02:08: for the assignment low and high grades by percentage.
02:11: And number of missing in late, submissions, You can hover over
02:15: a percentage bar and view the number of students who achieve each grade percentage.
02:21: To send a message to all students in the section, click the message icon.
02:27: When comparing sections, you can also view, submissions, by status missing
02:31: in late To view the names of students.
02:34: Within each status, click the link for the status
02:38: The card displays the student information for the submission, statuses, including
02:42: the names and last login date for each student.
02:46: To message these students specifically click the message icon
02:51: To export the submission status list as a CSV file click the download
02:55: link.
02:57: To view data for a student. Click the data point for the student.
03:02: In a student comparison details provided additional metrics for the student's
03:07: full name last access date section, current course
03:11: grade, percentage assignment name and due date the students grade for
03:15: the assignment, the course average percentage and the status of the assignment
03:19: and submission date.
03:22: To send a message to the individual student, click the message icon.
03:27: To export analytics data, as a CSV file, click the download
03:31: CSV button CSV data is exported according
03:35: to the filter data. CSV files display a student's
03:40: full name sortable, name canvas user ID, sis
03:44: user ID, or email. If applicable overall course grade,
03:48: the percent that assignments have been on time the last page view, time,
03:52: the last participation time, and the last time, the student logged
03:56: out
03:58: This guide covered how to compare the course, average chart graph with an assignment section
04:02: or student filter in new Analytics.
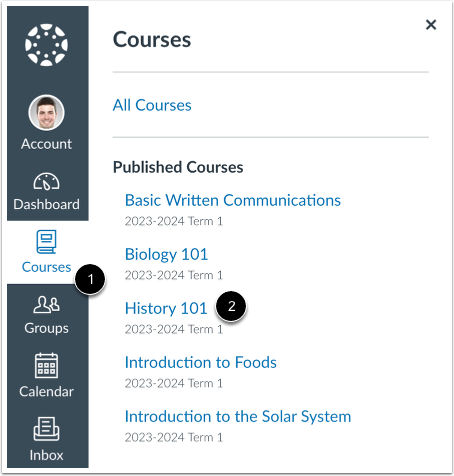
Open Course
In Global Navigation, click the Courses link [1], then click the name of the course [2].
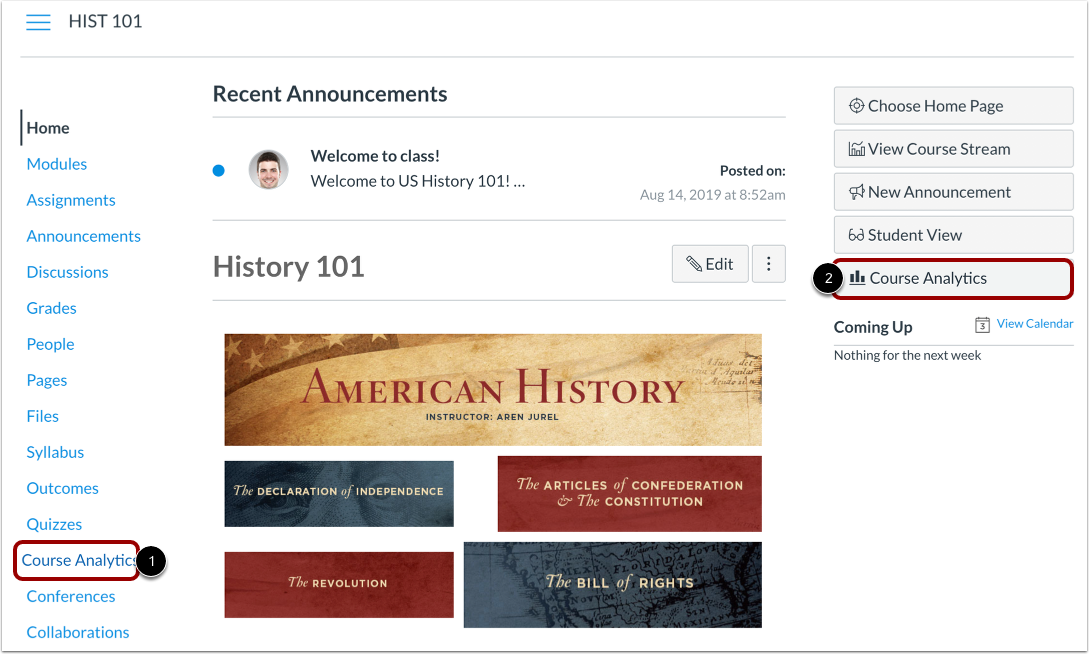
Open Course Analytics
To open Course Analytics, click the Course Analytics link in Course Navigation [1] or click the Course Analytics button in the Course Home Page [2].
Note: If you cannot view the Course Analytics link, you may have to make the link visible via the Navigation tab in Course Settings.
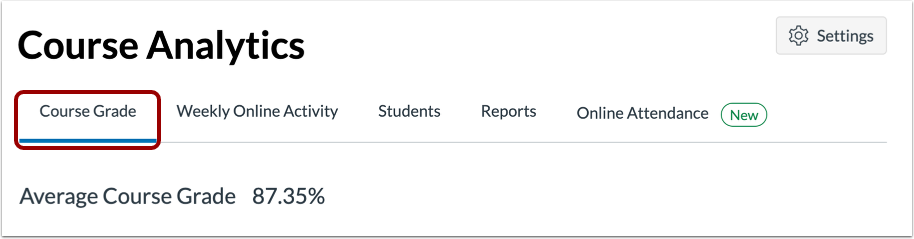
Open Course Grade Analytics
Click the Course Grade tab.
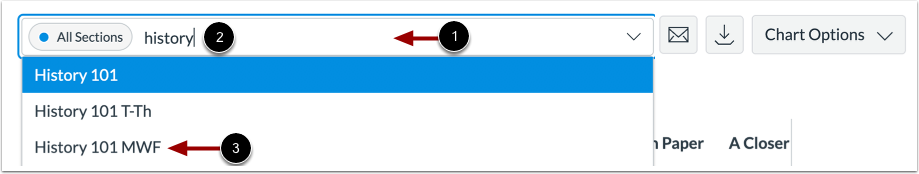
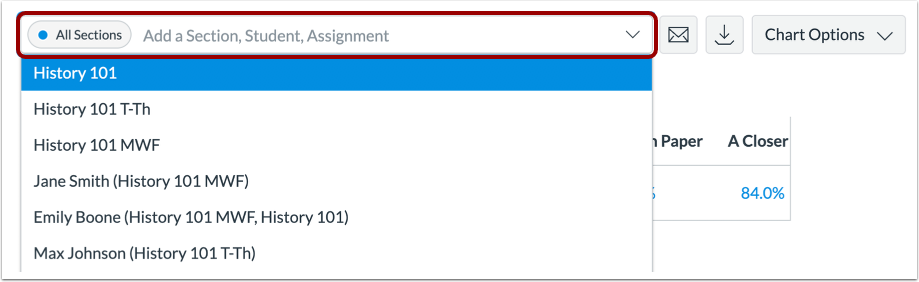
Filter Data
Click the Filter field [1]. Type the name of a section, student, or assignment [2]. Canvas will populate all matching results.
When the item displays in the menu, click the item name [3].
You can also click the Filter field and use the scroll to locate and select a section, student, or assignment.
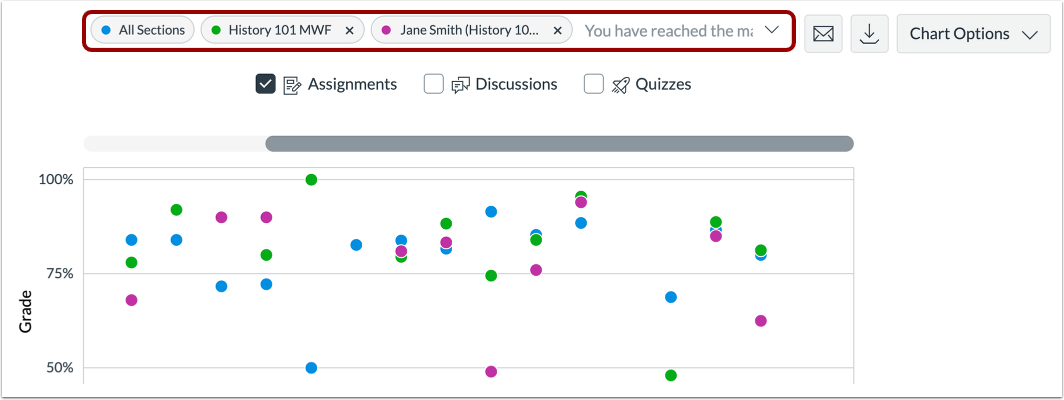
View Additional Filters
To add another filter, locate the additional filter. The Filter field supports up to three filters. The All Sections filter cannot be removed.
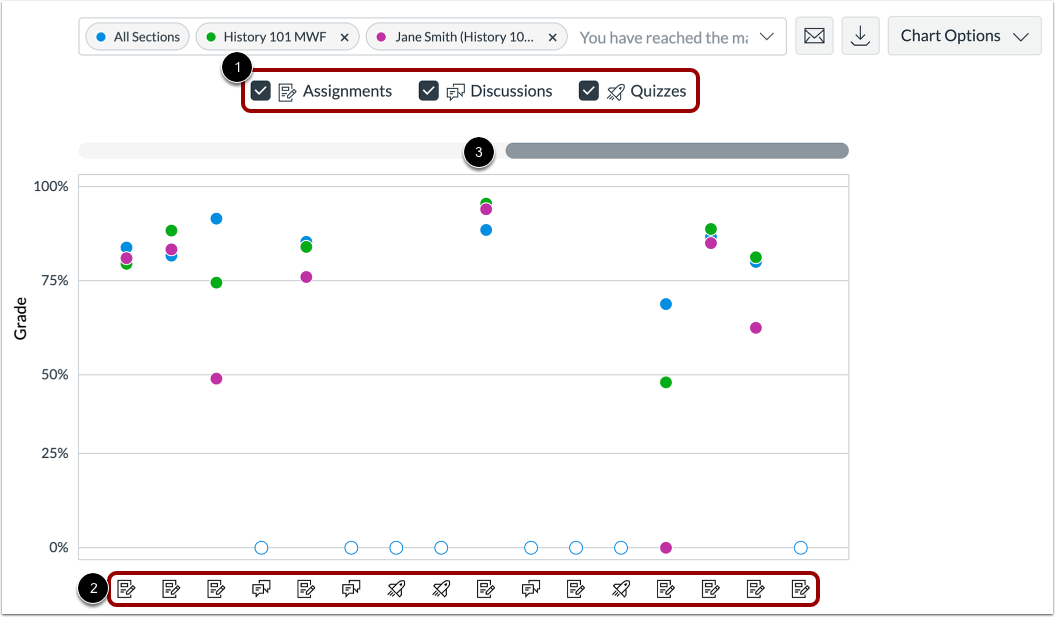
Filter by Assignment
By default, analytics selects all assignment types to display within the page [1]. Each assignment in the chart displays the appropriate icon for each selected assignment type [2]. To view additional assignments within the filtered results, click and drag the scrollbar [3].
Notes:
- The Quiz icon represents both classic quizzes and New Quizzes question types.
- If a newly created assignment is not yet visible, it may appear after the next data refresh (within 24 hours).
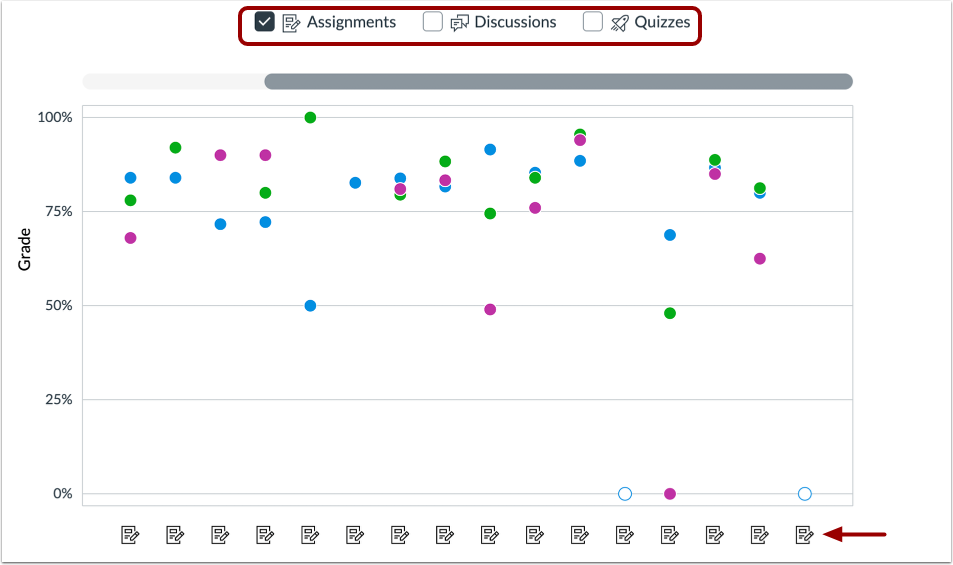
To filter by assignment type, remove the checkbox next to the assignment type. The chart dynamically updates the results based on the assignment type selected or removed in the filter.
Note: At least one assignment type is required at all times.
View Filtered Results
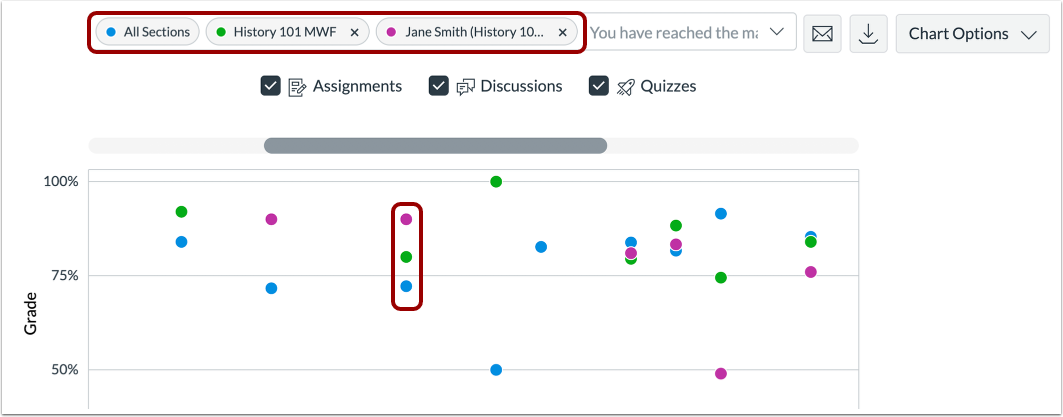
The added filter displays in the analytics results. Each filter is identified by a specific color.
Each filter displays as a data point within the table.
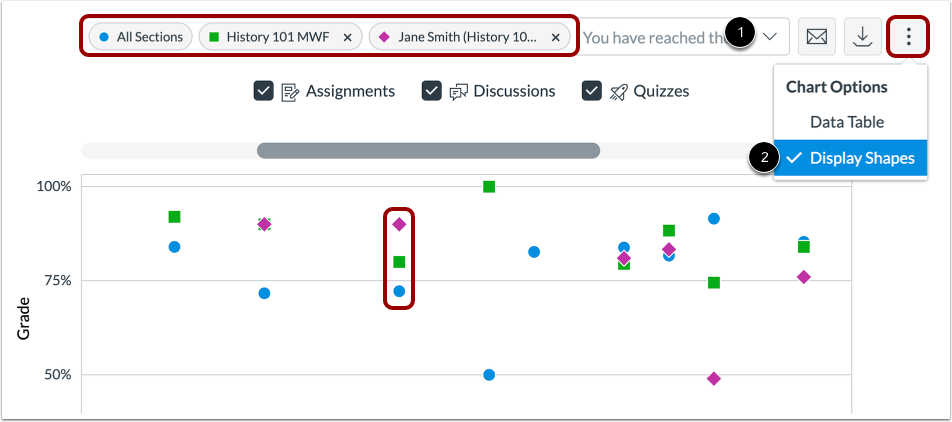
When viewing filters, the default shape for each color is a circle, but you can choose to enable shapes for improved contrast by clicking the Chart Options icon [1] and selecting the Display Shapes option [2].
View Section Comparison
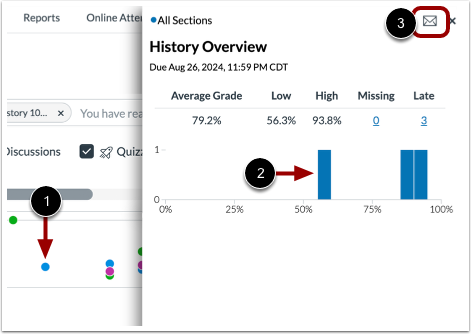
To view data for a section, click the data point for the section [1].
In a section comparison, details provide additional metrics for the section name, assignment name, assignment due date, average grade for the assignment, low and high grades by percentage, and number of missing and late submissions. You can hover over a percentage bar and view the number of students who achieved each grade percentage [2].
To send a message to all students in the section, click the Message icon [3].
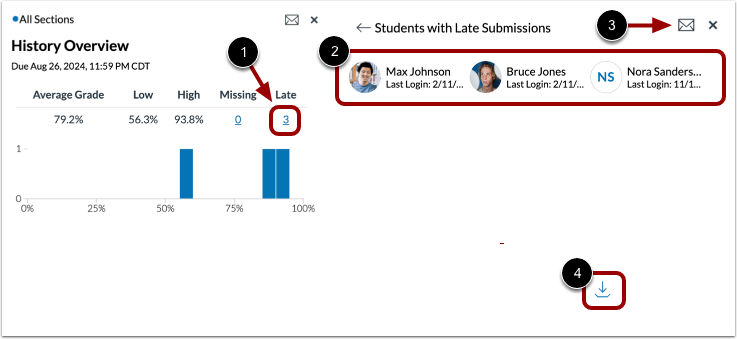
When comparing sections, you can also view submissions by status: missing and late. To view the names of students within each status, click the link for the status [1]. The card displays the student information for the submission statuses, including the names and last login date for each student [2].
To message these students specifically, click the Message icon [3].
To export the submission status list as a CSV file, click the Download link [4].
View Student Comparison
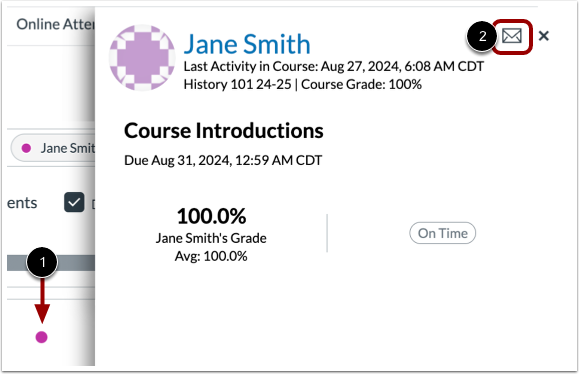
To view data for a student, click the data point for the student [1].
In a student comparison, details provide additional metrics for the student's full name, last access date, section, current course grade percentage, assignment name and due date, the student's grade for the assignment, the course average percentage, and the status of the assignment and submission date.
To send a message to the individual student, click the Message icon [2].
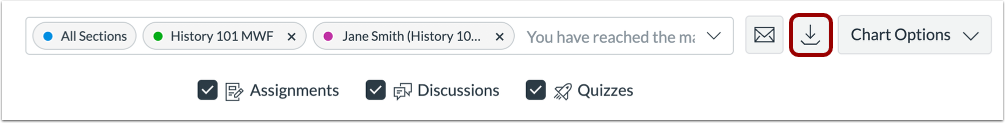
Export Table CSV
To export analytics data as a CSV file, click the Download CSV button.
CSV data is exported according to the filtered data.
CSV files display a student's full name, sortable name, Canvas user ID, SIS user ID or email (if applicable), overall course grade, the percent that assignments have been on time, the last page view time, the last participation time, and the last time the student logged out.