Instructors can hide the box and whisker plot (grade distribution) graphs to keep students from viewing the summary statistics of the class and figuring out each others' grades. By default, the whisker graph is on. When the grade distribution graph is hidden, students cannot view any aspect of the graph, including the high, low, and mean scores.
Note: The grade distribution graph displays for students after five or more students submit the assignment and remains visible for instructors after hiding the graph from students.
View the video transcript
00:07: How do I hide grade distribution scoring details from students?
00:11: In Course Navigation, click the Settings link.
00:15: Click the Course Details tab.
00:17: Check the Hide grade distribution graphs from students checkbox.
00:22: Click the Update Course Details button.
00:25: When the grade distribution graph is hidden, students can view their score, but cannot view any other aspect of the graph, including the high, low, and mean scores.
00:36: This guide covered how to hide grade distribution scoring details from students.
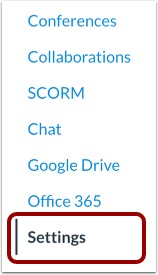
Open Settings
In Course Navigation, click the Settings link.
Open Course Details
Click the Course Details tab.
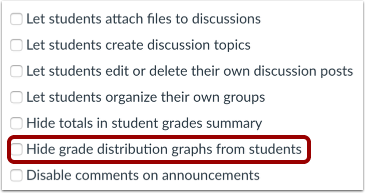
Hide Grade Distribution
Check the Hide grade distribution graphs from students checkbox.
Update Course Details
Click the Update Course Details button.
Student View
When the grade distribution graph is hidden, students can view their score, but cannot view any other aspect of the graph, including the high, low, and mean scores.