As a district admin, you can view student academic achievement over the course of a school year by creating a growth report. Growth reports compare one benchmark assessment score with a second. You can select any two benchmark assessments from which to measure growth. You can also specify a growth goal. The growth goal is the percentage of improvement you expect to see from the first to the second benchmark and is applied using a sliding scale.
Growth report automatically compare the first and second benchmark scores, and Mastery Connect calculates whether individual students met the growth goal.
Notes:
- In a growth report, the calculated percentage for students that met growth only includes data for students who have completed both benchmarks.
- Only Mastery Connect accounts with SIS integrations can generate growth reports.
- You can generate the growth projection reports before students take the second assessment.
- Growth reports are a District Administrator-level feature.
- You can only generate a growth report for current-year benchmarks that are private to your district, marked as unavailable, and in a current-year tracker.
Open Growth Reports
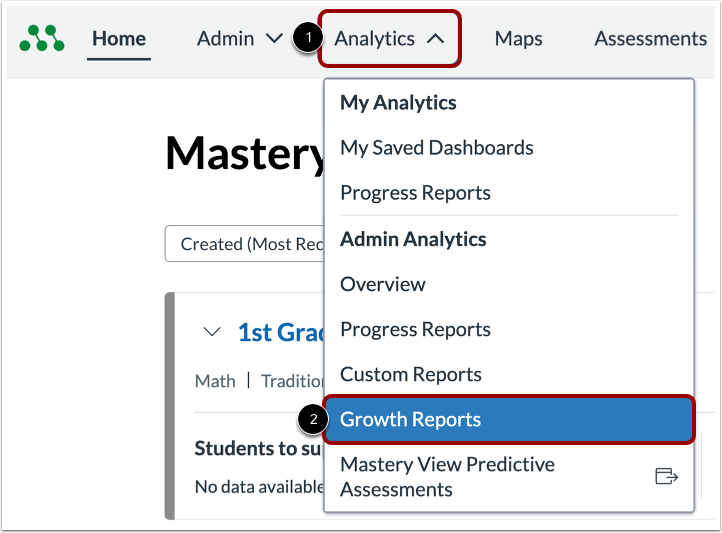
In the Global Navigation menu, click the Analytics drop-down menu [1]. Click the Growth Reports link [2].
Add Growth Report
Click the Add Report button.
Add Report Title and Description
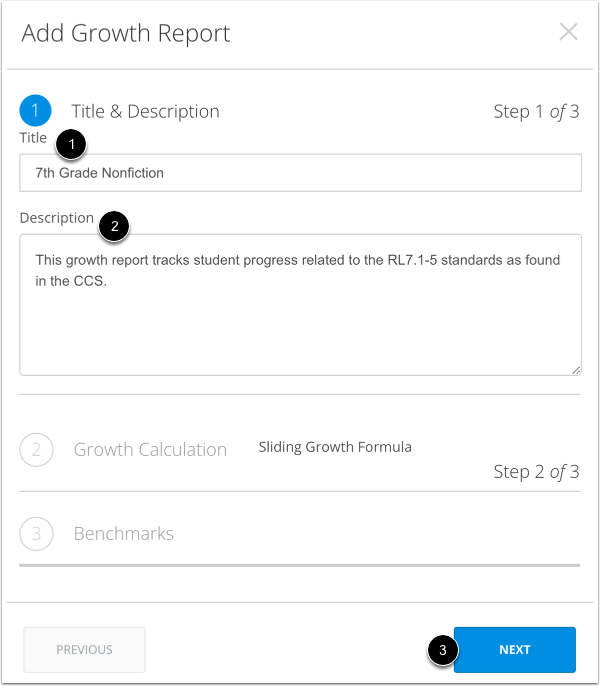
Enter a report title in the Title field [1].
Enter a report description in the Description field [2].
Then, click the Next button [3].
Add Growth Goal
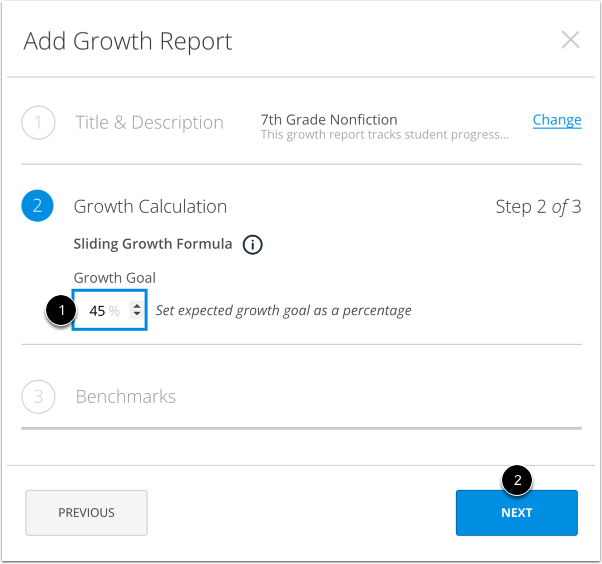
Type or use the up and down arrows to enter a number in the Growth Goal box [1].
Growth goals identify the desired increase in students' scores from one assessment result to the next. Growth goals are stated as a percentage and can only be entered as whole numbers.
Click the Next button [2].
Add Benchmarks
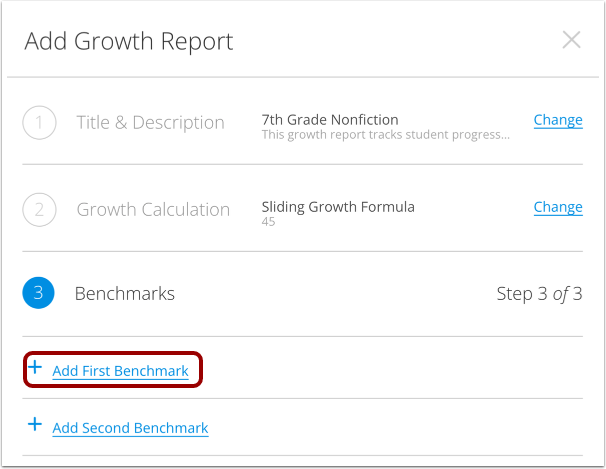
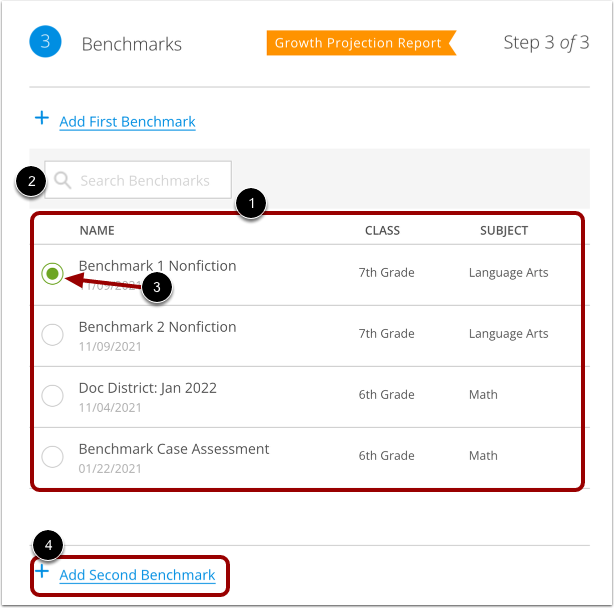
To select the first benchmark assessment, click the Add First Benchmark link [1]. Growth reports compare results from the first benchmark against the results from the second benchmark.
Select First Benchmark
View a list of available benchmarks in the Benchmarks list [1]. The Benchmark list displays the name, class, and subject for each listed benchmark. For a benchmark to display in the growth report Benchmark list, it must meet the following criteria:
To search for a benchmark, enter a benchmark title in the Search field [2].
To select a benchmark in the list, click the assessment radio button [3].
Then click the Add Second Benchmark link [4].
Growth Projection Reports
When you create a growth report, if students have already taken the first of two benchmarks, you can generate a growth projection report. Growth projection reports determine the score a student would need on the second benchmark assessment to meet a growth goal. Once generated, you can export and view the data as a CSV file.
Generating a Growth Projection Report
You can generate a growth projection report when configuring a growth report. The option to create a projection report displays after you add the first benchmark assessment but before you add the second benchmark.
Select Second Benchmark
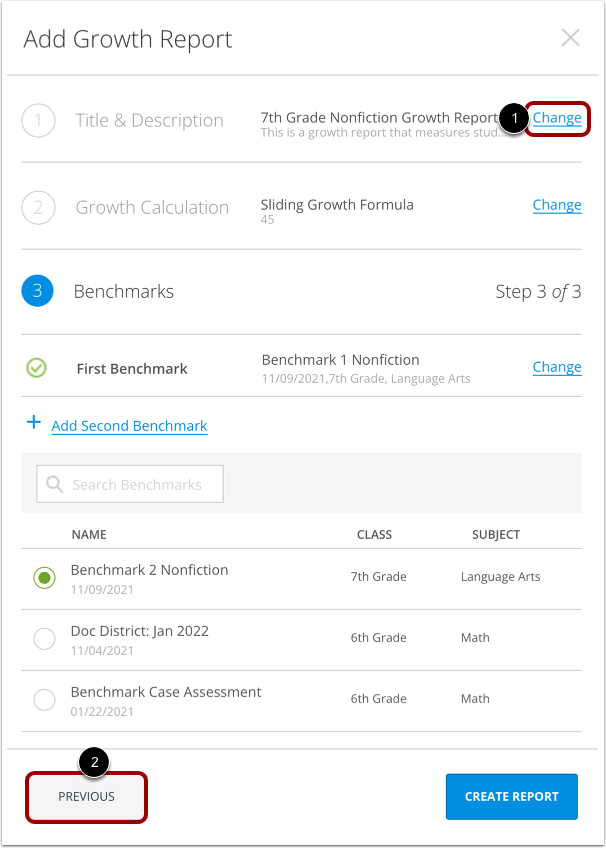
View the benchmark selected as First Benchmark [1].
To select the second benchmark, locate the benchmark in the list, and click the assessment radio button [2].
Verify Report Details
Before running the report, review your report details.
To change information in any of the report creation steps, click the Change link [1] or the Previous button [2].
Create Growth Report
Click the Create Report button.
Growth Report
A growth report measures student achievement over the course of a school year by comparing one benchmark assessment score with a second. Mastery Connect uses a sliding scale calculation to determine student growth from one benchmark to the second.
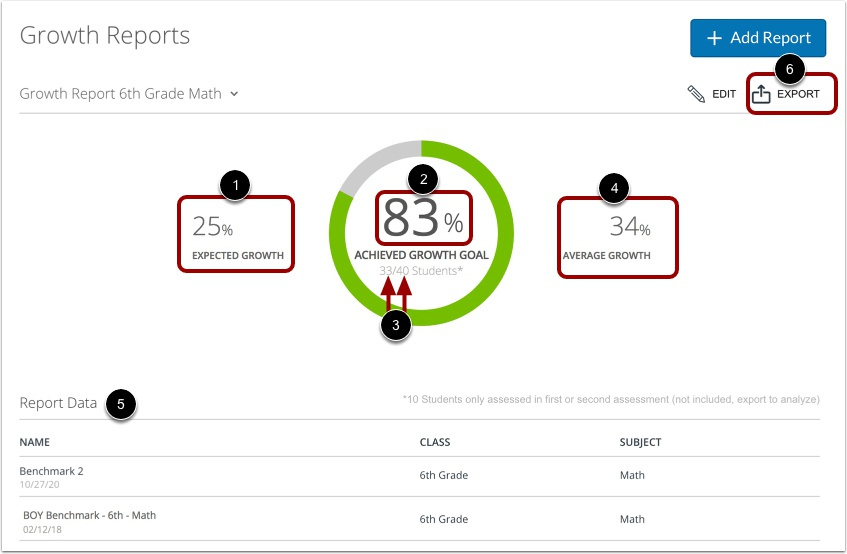
The growth goal displays as the Expected Growth percentage [1]. The percent of students that achieved the growth goal displays as the Achieved Growth Goal percentage [2]. You can also view the number of students who met the goal out of the number of students who took the assessment [3]. For more information, visit our guide on growth report calculations.
The average percent of growth achieved from the first to the second benchmark displays as the Average Growth percentage [4].
The assessments, grade levels, and subjects display in the Report Data table [5].
To export the report as a CSV file and to view individual student data, click the Export link [6].
Sliding Scale Calculation
The sliding scale formula for a growth goal is as follows:
<span style="color:rgb(255,38,0);"><strong>x</strong></span><strong>+(1-</strong><span style="color:rgb(255,38,0);"><strong>x</strong></span><strong>)*</strong><span style="color:rgb(0,150,255);"><strong>y</strong></span><strong>=</strong><span style="color:rgb(148,55,255);"><strong>n</strong></span><strong></strong>(<span style="color:rgb(255,38,0);"><strong>x</strong></span>=first benchmark score;<strong></strong><span style="color:rgb(0,150,255);"><strong>y</strong></span>=expected growth goal; <span style="color:rgb(148,55,255);"><strong>n</strong></span>=growth achievement score)
For example, if a student scores 60% on their first benchmark and the growth goal is set at 35%, the formula would look like this:
<span style="color:rgb(255,38,0);"><strong>0.6</strong></span><strong>+(1-</strong><span style="color:rgb(255,38,0);"><strong>0.6</strong></span><strong>)*</strong><span style="color:rgb(0,150,255);"><strong>0.35</strong></span><strong></strong>which simplifies to <span style="color:rgb(255,38,0);"><strong>0.6</strong></span><strong>+(0.4)*</strong><span style="color:rgb(0,150,255);"><strong>0.35</strong></span><strong></strong>which simplifies to <span style="color:rgb(255,38,0);"><strong>0.6</strong></span><strong>+ </strong><span style="color:rgb(0,150,255);"><strong>0.14</strong></span><strong>=</strong><span style="color:rgb(148,55,255);"><strong>0.74</strong></span>
Using this example:
- In a Growth Report, if the student scored 74% or higher on the second benchmark they meet the growth goal.
- In a Growth Projection Report, the report CSV will indicate that the student must score at or above a 74% on the second benchmark to meet the growth goal.