Admin Analytics and New Analytics data is pulled from Canvas Data 2 (CD2)/Data Access Platform (DAP).
If enabled by your institution, you can use Admin Analytics to view, filter, and download data about Canvas usage.
For more information, visit the Admin Analytics Chart and Data Definitions resource document.
Notes:
- Admin Analytics is an account feature option.
- To view Admin Analytics data for their sub-account(s), sub-account admins must have the Admin Analytics - View and Export Data permission enabled.
- Admin Analytics provides analytics data about all Canvas courses, including public courses. However, participations and page view data includes only users with student or instructor roles.
View the video transcript
00:07: How do I use admin Analytics?
00:12: In global navigation, click the admin link, then click the name of
00:16: the account.
00:18: In account navigation, click the admin analytics link.
00:22: In admin analytics. You can view data by dashboard filter data
00:26: view filter details and view an individual dashboards data.
00:32: You can filter data using the following menus,
00:36: Sub accounts terms courses and teachers.
00:40: The course status filter, includes the following options.
00:42: Concluded with activity concluded without activity, published
00:47: with activity published without activity, deleted and unpublished.
00:53: The course format filter includes the following options, not set on
00:57: campus online and Blended.
01:05: The date granularity filter allows you to choose between viewing Trends by weak
01:09: or months.
01:11: The course start date filter allows you to choose a course.
01:13: Start date range.
01:16: The course activity criteria filter includes the following options.
01:19: Enrolled students with at least one page view, enrolled instructors
01:23: course participation and course page views
01:28: The Student Activity criteria filter includes, the following options, participation
01:32: page, views, and days since last access.
01:37: To search within a filter menu, enter a search term in the search field.
01:41: A maximum of 500 search results are returned.
01:45: To select all of the results, click the select all linked.
01:50: In admin analytics, you can view data via the overview course
01:54: and student dashboards
01:59: The overview dashboard displays account courses by status student and
02:03: teacher engagement data, various data over a given time and
02:07: average course grades.
02:10: The course dashboard displays course grade and engagement statistics feature
02:14: used data courses with low, average grades and courses with low
02:18: Student Activity.
02:21: The student dashboard displays student grade and engagement, statistics grade
02:25: averages, submissions by status, and student details.
02:31: To refresh your dashboards cache. Click the options icon, then
02:35: click the clear cache and refresh link.
02:38: To download a summary of the dashboard. You are viewing, on your computer.
02:41: Click the download link.
02:45: This guide covered how to use admin Analytics.
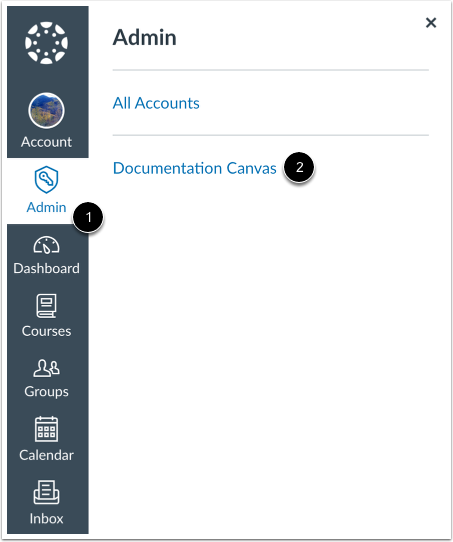
Open Account
In Global Navigation, click the Admin link [1], then click the name of the account [2].
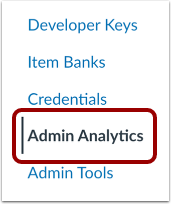
Open Admin Analytics
In Account Navigation, click the AdminAnalytics link.
View Admin Analytics
In Admin Analytics, you can view data by dashboard [1], filter data [2], view filter details [3], and view an individual dashboard's data [4].
Notes:
- By default, the Overview Dashboard displays are filtered by the active term.
- In the Admin Analytics navigation, the Intelligent Insights menu only displays for users who have opted into Intelligent Insights.
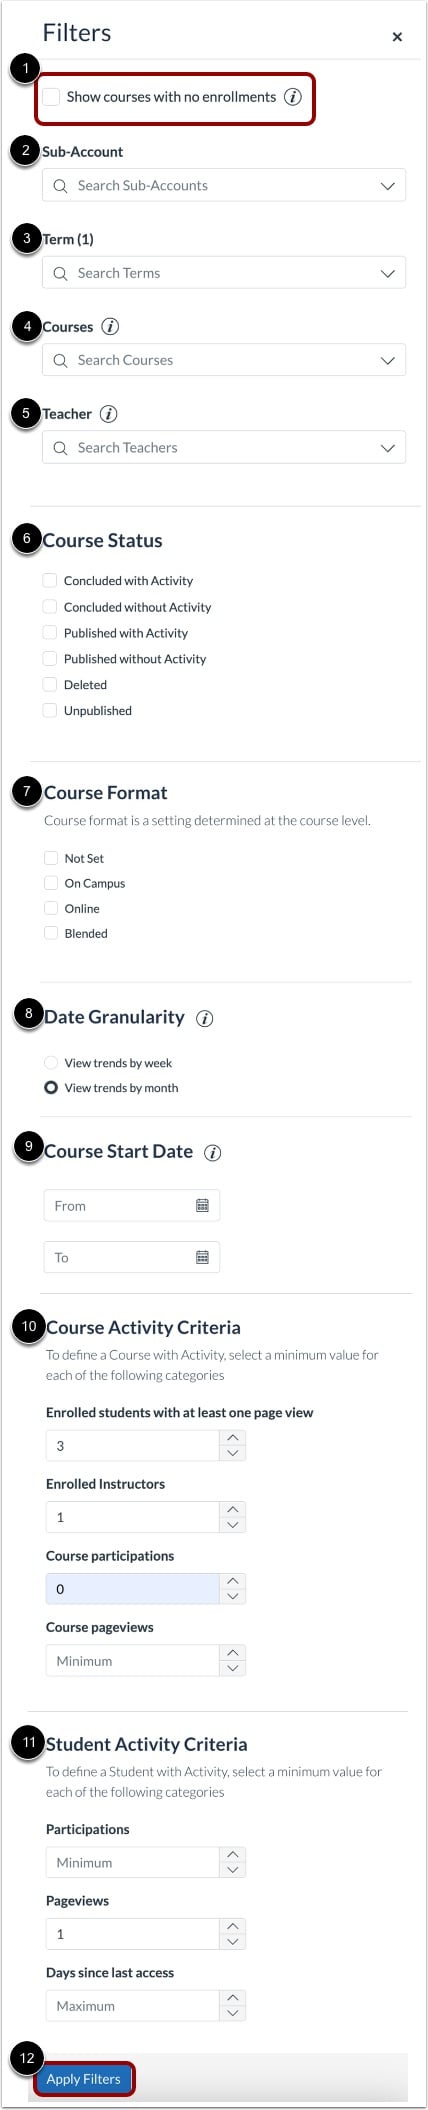
Apply Filters
To view courses with no enrollments, click the Show courses with no enrollments checkbox [1].
You can filter data using the following menus:
- Sub-Accounts [2]
- Term [3]
- Course [4]
- Teacher [5]
- Course Status [6]
- Course Format [7]
- Date Granularity [8]
- Course Start Date [9]
- Course Activity Criteria [10]
- Student Activity Criteria [11]
To apply the selected filters, click the Apply Filters button [12].
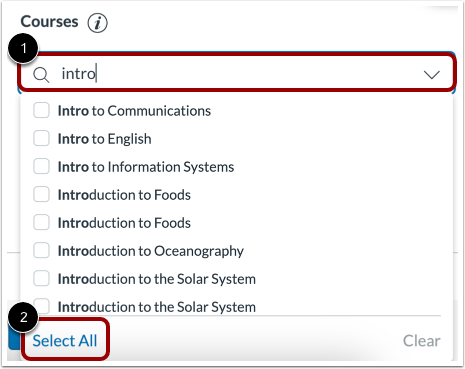
To search within a filter menu, enter a search term in the search field [1]. A maximum of 500 search results are returned.
To select all of the results, click the Select All link [2].
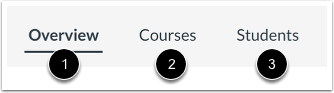
View Dashboards
In Admin Analytics, you can view data via the Overview, Course, and Student Dashboards.
- Overview Dashboard[1]: displays account courses by status, student and teacher engagement data, various data over a given time, and average course grades.
- Course Dashboard[2]: displays course grade and engagement statistics, feature use data, courses with low average grades, and courses with low student activity.
- Student Dashboard[3]: displays student grade and engagement statistics, grade averages, submissions by status, and student details [3].
You can also manage statistic and chart data.
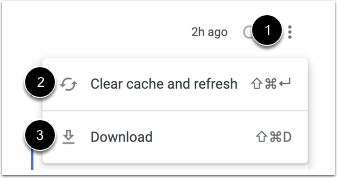
Refresh Cache and Download Analytics
To refresh your dashboard's cache, click the Options icon [1], then click the Clear cache and refresh link [2].
To download a summary of the dashboard you are viewing on your computer, click the Download link [3].