00:05: What is Course Analytics?
00:07: To access Course Analytics from Course Navigation,
00:10: click the Course Analytics link.
00:13: You can also access Course Analytics from the Course Analytics button in
00:17: the Course Home Page.
00:20: You can use Course Analytics to track
00:22: course grades for student submissions, course activity,
00:25: individual student data, communication data, submission status data, and
00:29: online attendance. As an instructor, you can perform various activities
00:33: using the following tabs in Course Analytics:
00:37: Course Grade: View average course grade analytics
00:40: as an interactive chart graph or a data table.
00:43: You can also compare the course average with an individual assignment, course
00:47: section, or student filter using the chart graph comparison or data
00:51: table comparison.
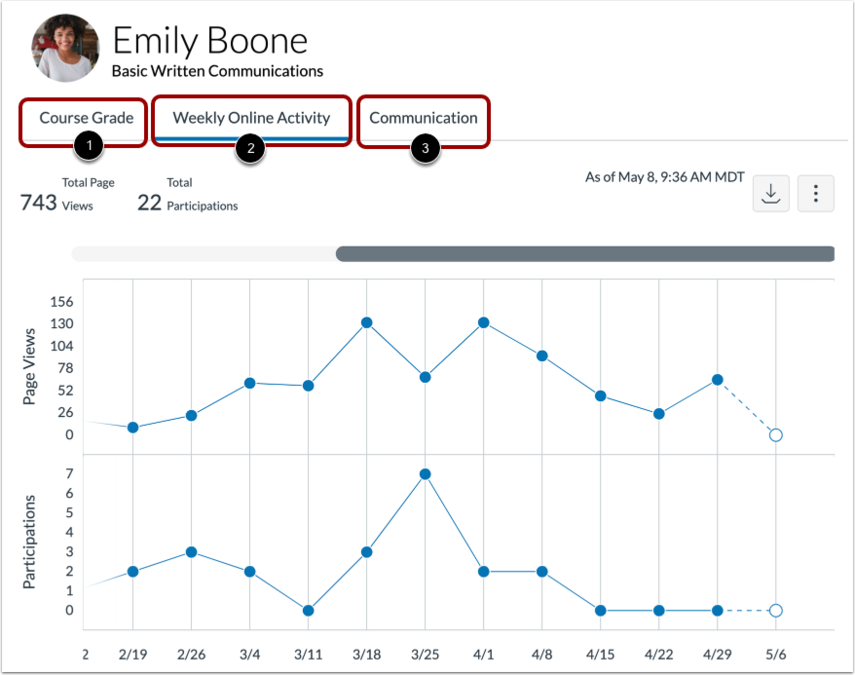
00:53: Weekly Online Activity: Access page view and participation data as
00:57: an interactive chart graph or a data table.
01:00: You can also compare the course average weekly online participation
01:04: analytics with an individual student or section using the chart graph
01:08: comparison or data table comparison.
01:11: Students: View grade and participation analytics for individual students.
01:16: You can also view message communication data between you
01:20: and individual students.
01:22: Reports: Run and download reports on missing, late, or excused
01:27: assignments. The Class Roster report provides a list of enrolled students along
01:31: with their contact information. The Course Activity report provides a
01:35: list of daily user interactions
01:37: in course resources.
01:40: Online Attendance: Discover whether students have met online attendance criteria
01:44: that has been selected by an admin. Admins must enable and configure
01:48: this report.
01:50: You can also use Course Analytics to communicate with students based on the analytics.
01:55: You can: Send a message to all students based
01:59: on specific course grade or participation criteria.
02:02: Send a message to an individual student based on specific course
02:07: grade or participation criteria.
02:10: You can use course, analytics as a student to view and or download
02:14: data about your grades course activity and communication to
02:18: access data, click the following tabs.
02:22: Course Grade: View a graph or table displaying your grades and submissions
02:26: Weekly Online Activity: View a graph or table displaying page views and
02:31: participation activities.
02:33: Communication: View a graph or table displaying Inbox message data.
02:38: A "page view" is when you open a page in a course. Page views can
02:43: give indicate how a user has been accessing course resources.
02:46: However, because page view data is based on requests
02:50: to the server, use page view data as a good approximation to activity
02:54: and not an absolute metric. Page view data is most valuable
02:59: for understanding whether activity occurred, and to make comparisons across
03:03: students within a course or when viewing trends week to week.
03:08: Several actions define participation in canvas and collectively describe
03:12: events where a user takes an action within a course, the following
03:17: student actions generate analytics course participation Announcements
03:23: posts. A new comment to an announcement.
03:26: Assignments submits an assignment.
03:29: Collaborations loads a collaboration to view.
03:31: Edit a document. Conferences.
03:34: Joins a Web Conference. Discussions posts and
03:38: new comment to a discussion. New quizzes, submits a
03:43: new quiz. Pages, creates a page.
03:46: Quizzes, submits a quiz. Who is starts taking a
03:50: quiz?
03:52: This guide covered Course Analytics.