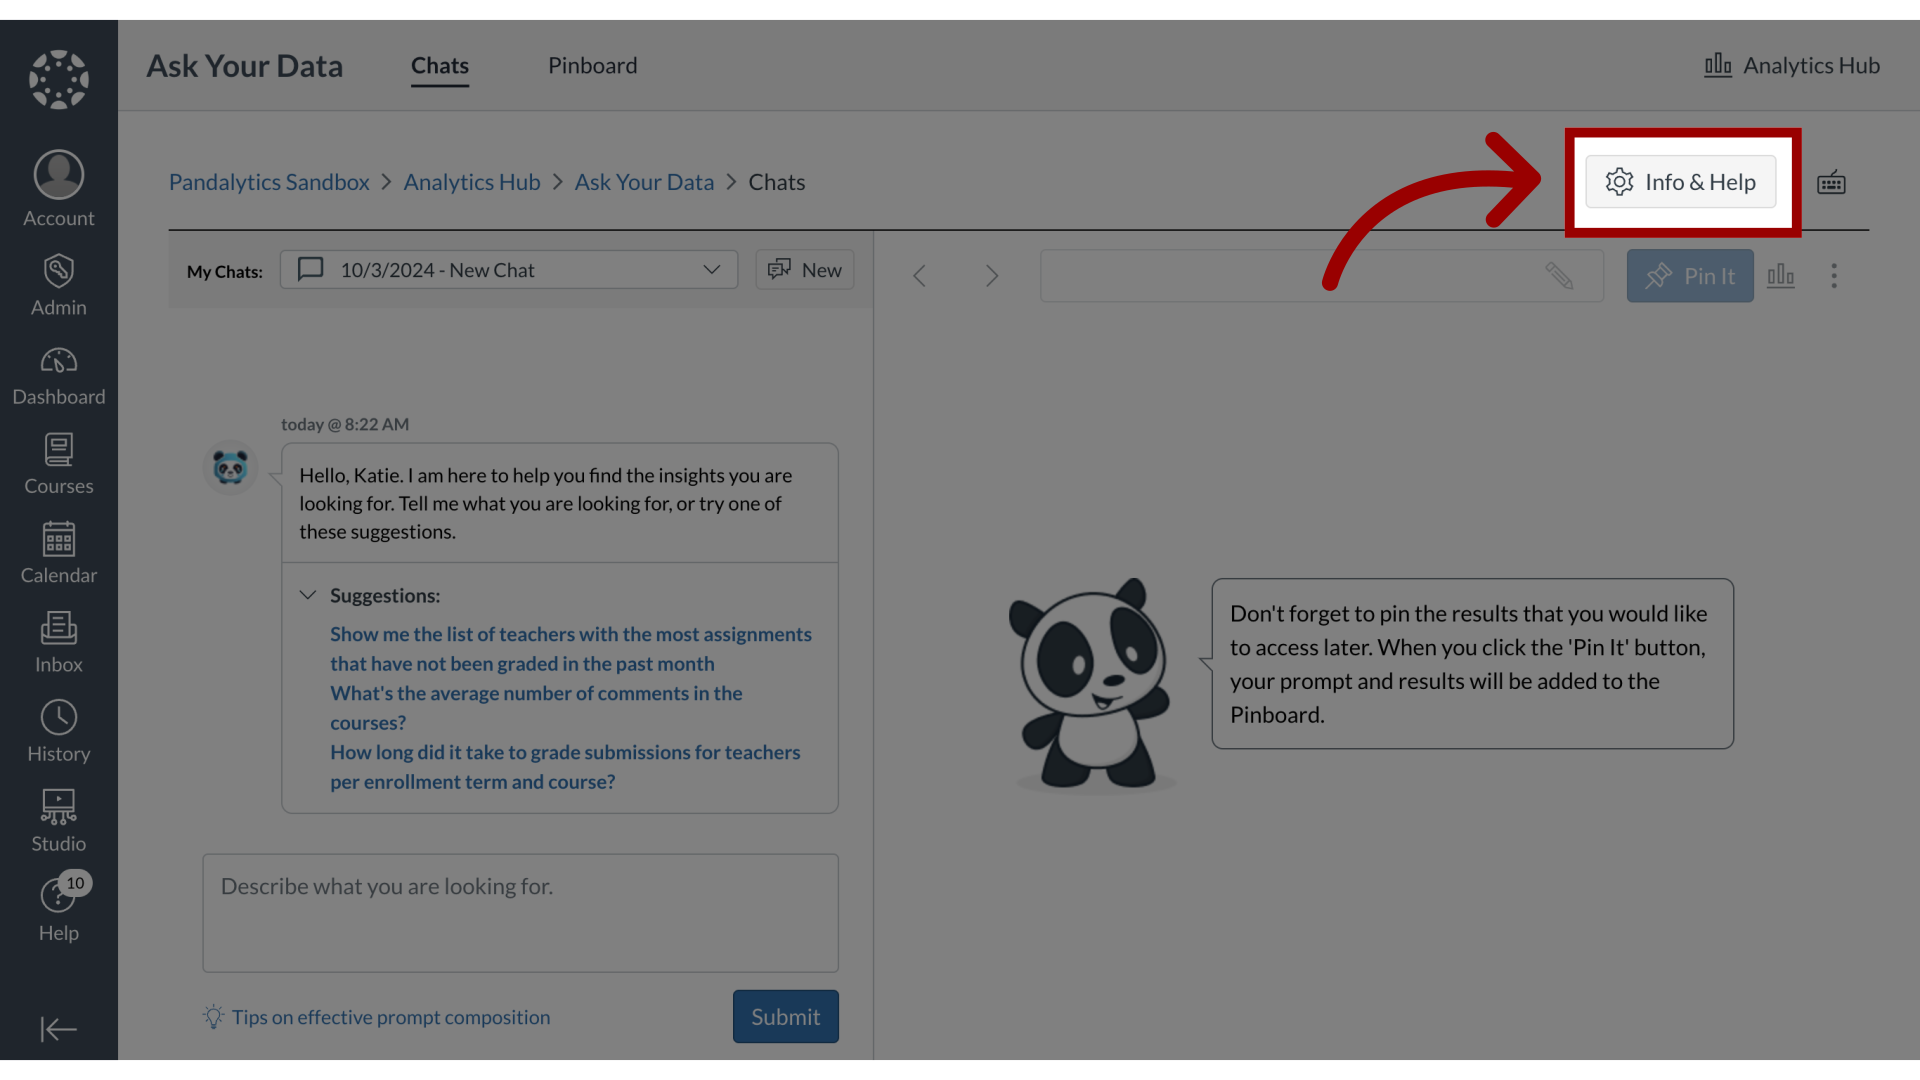
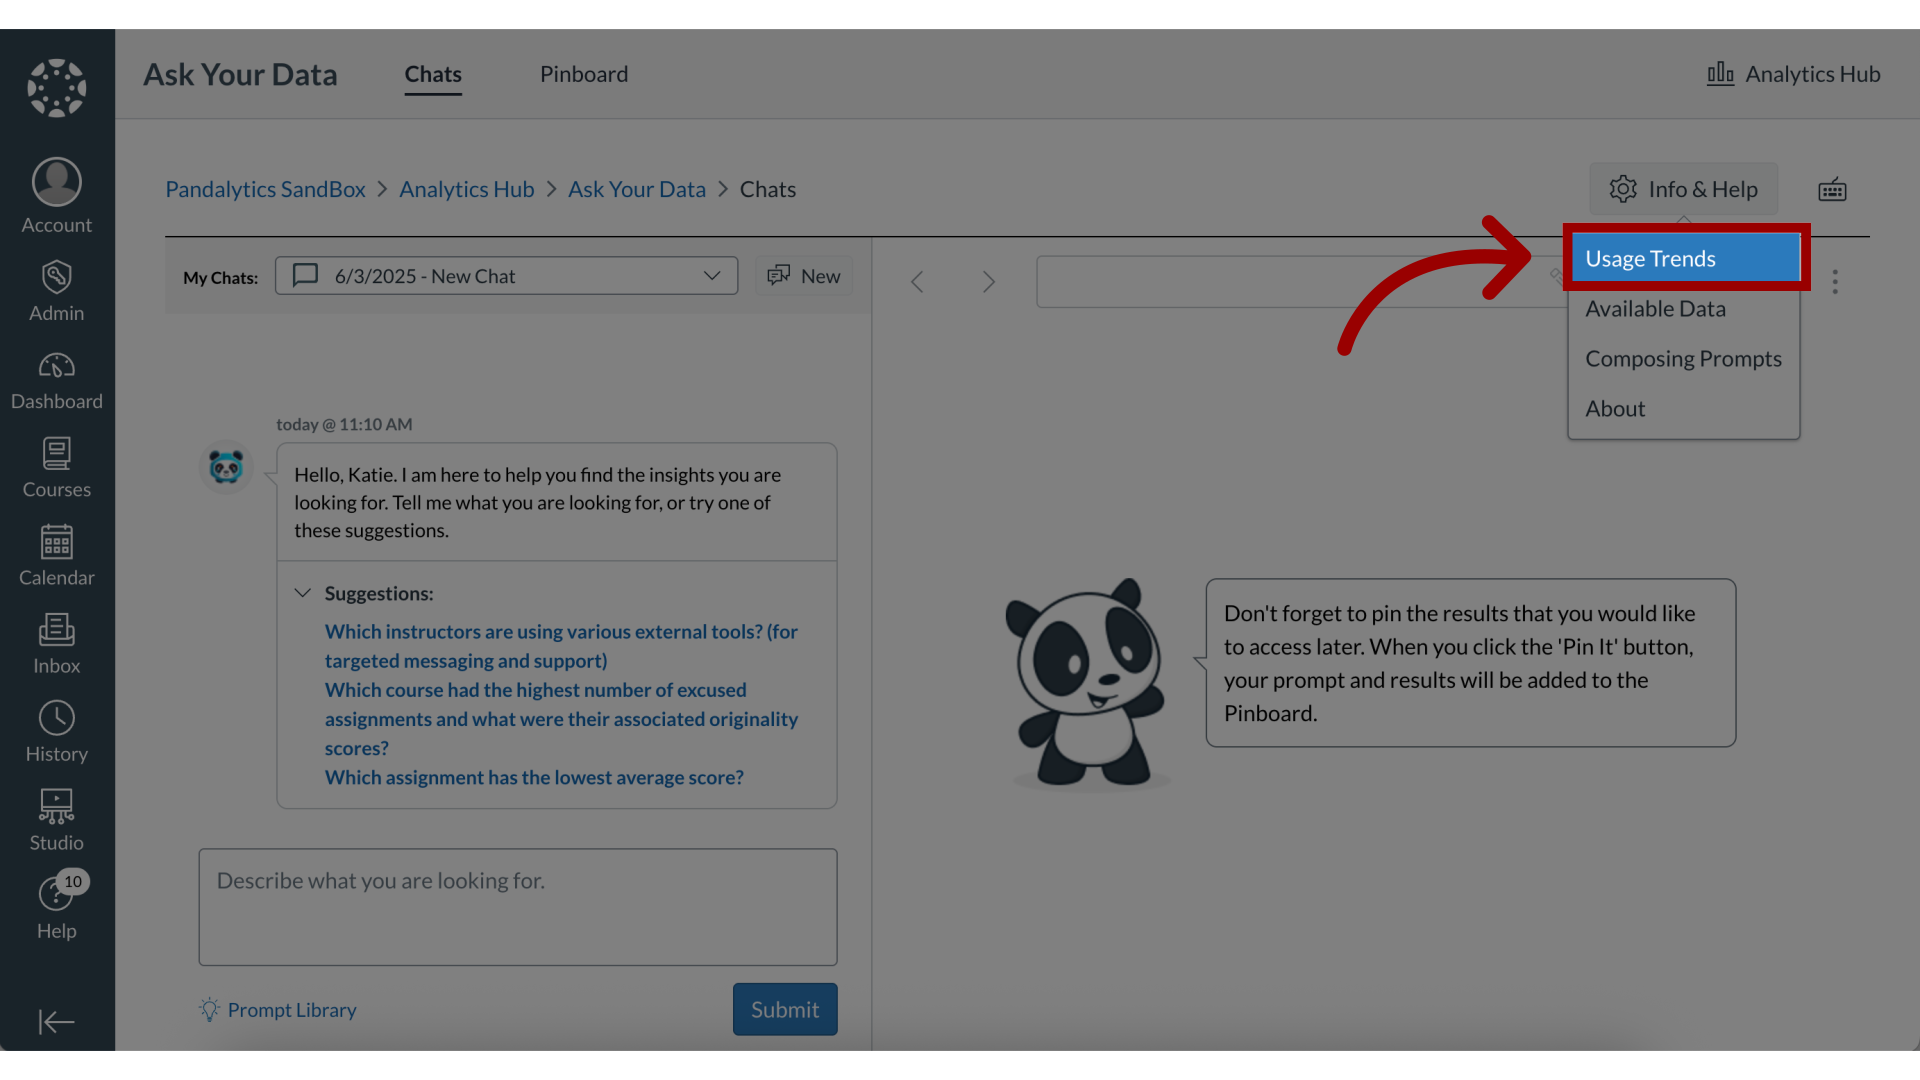
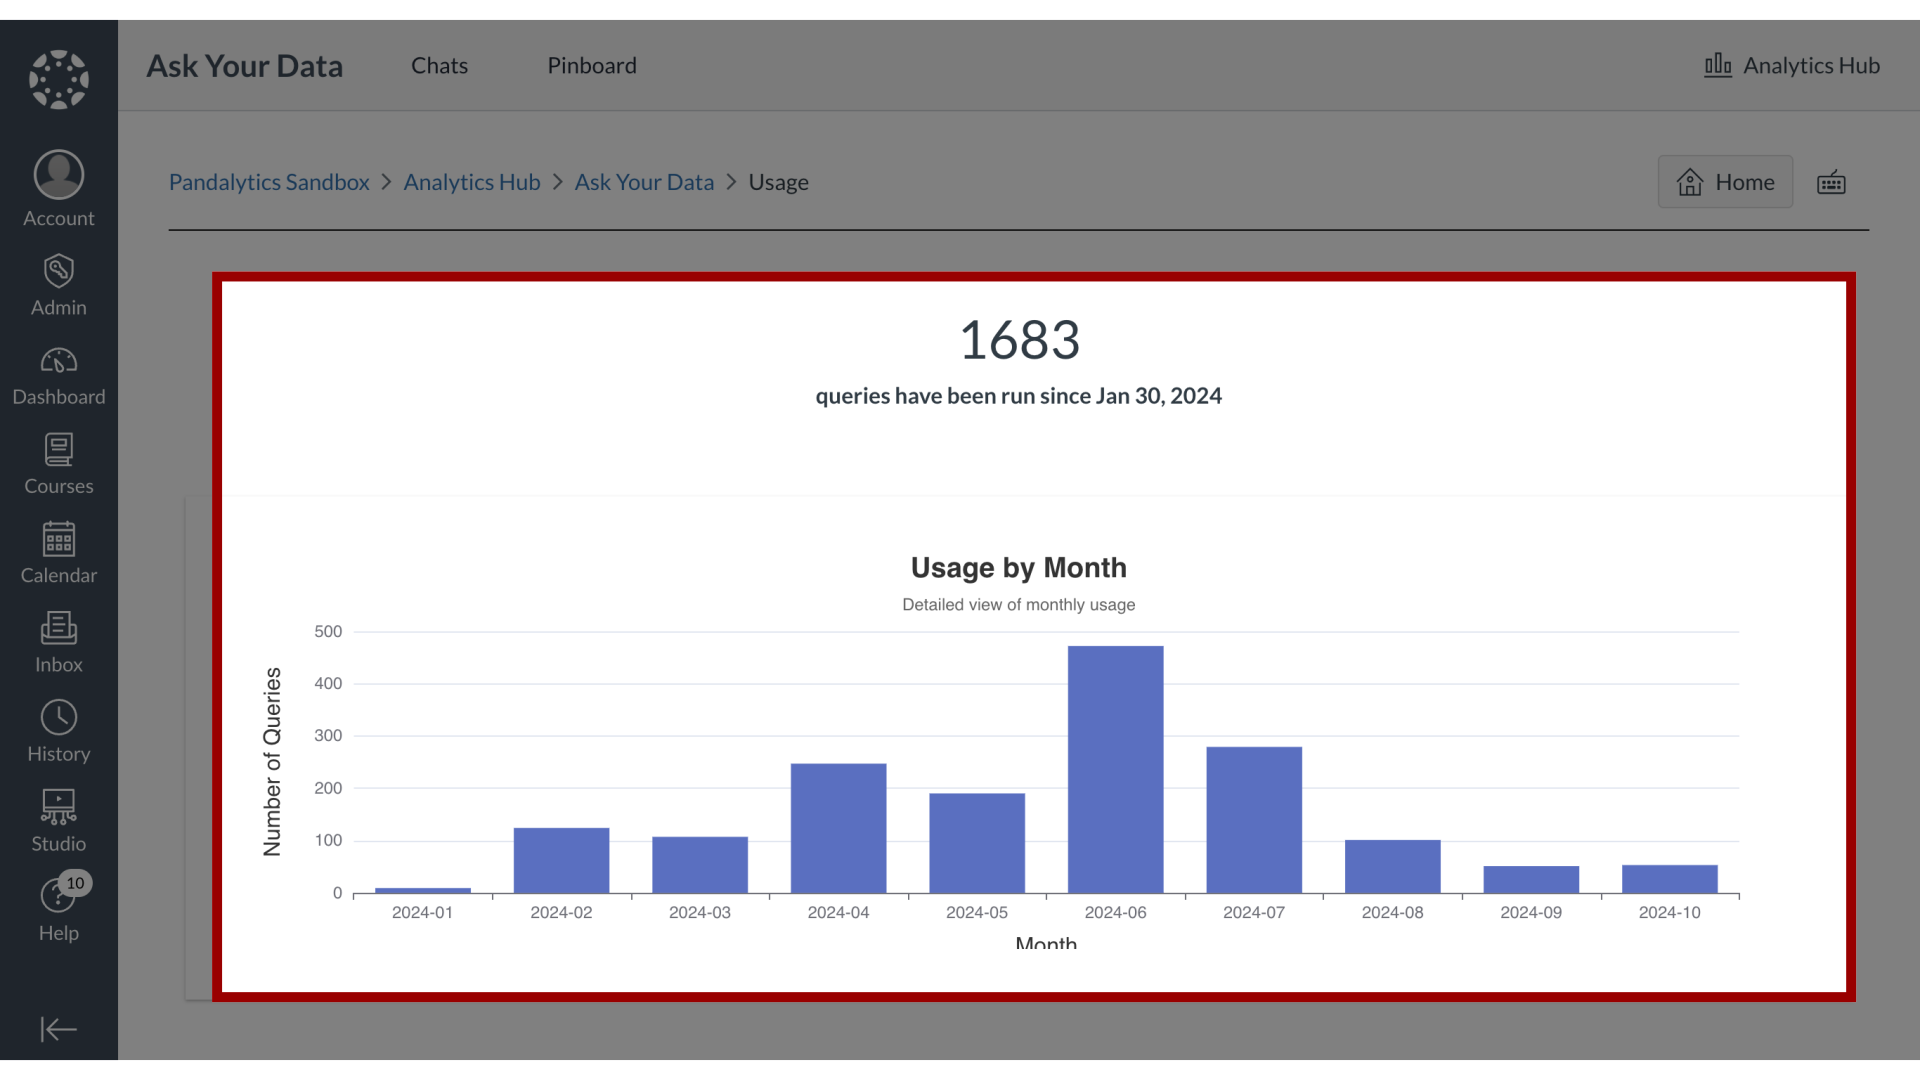
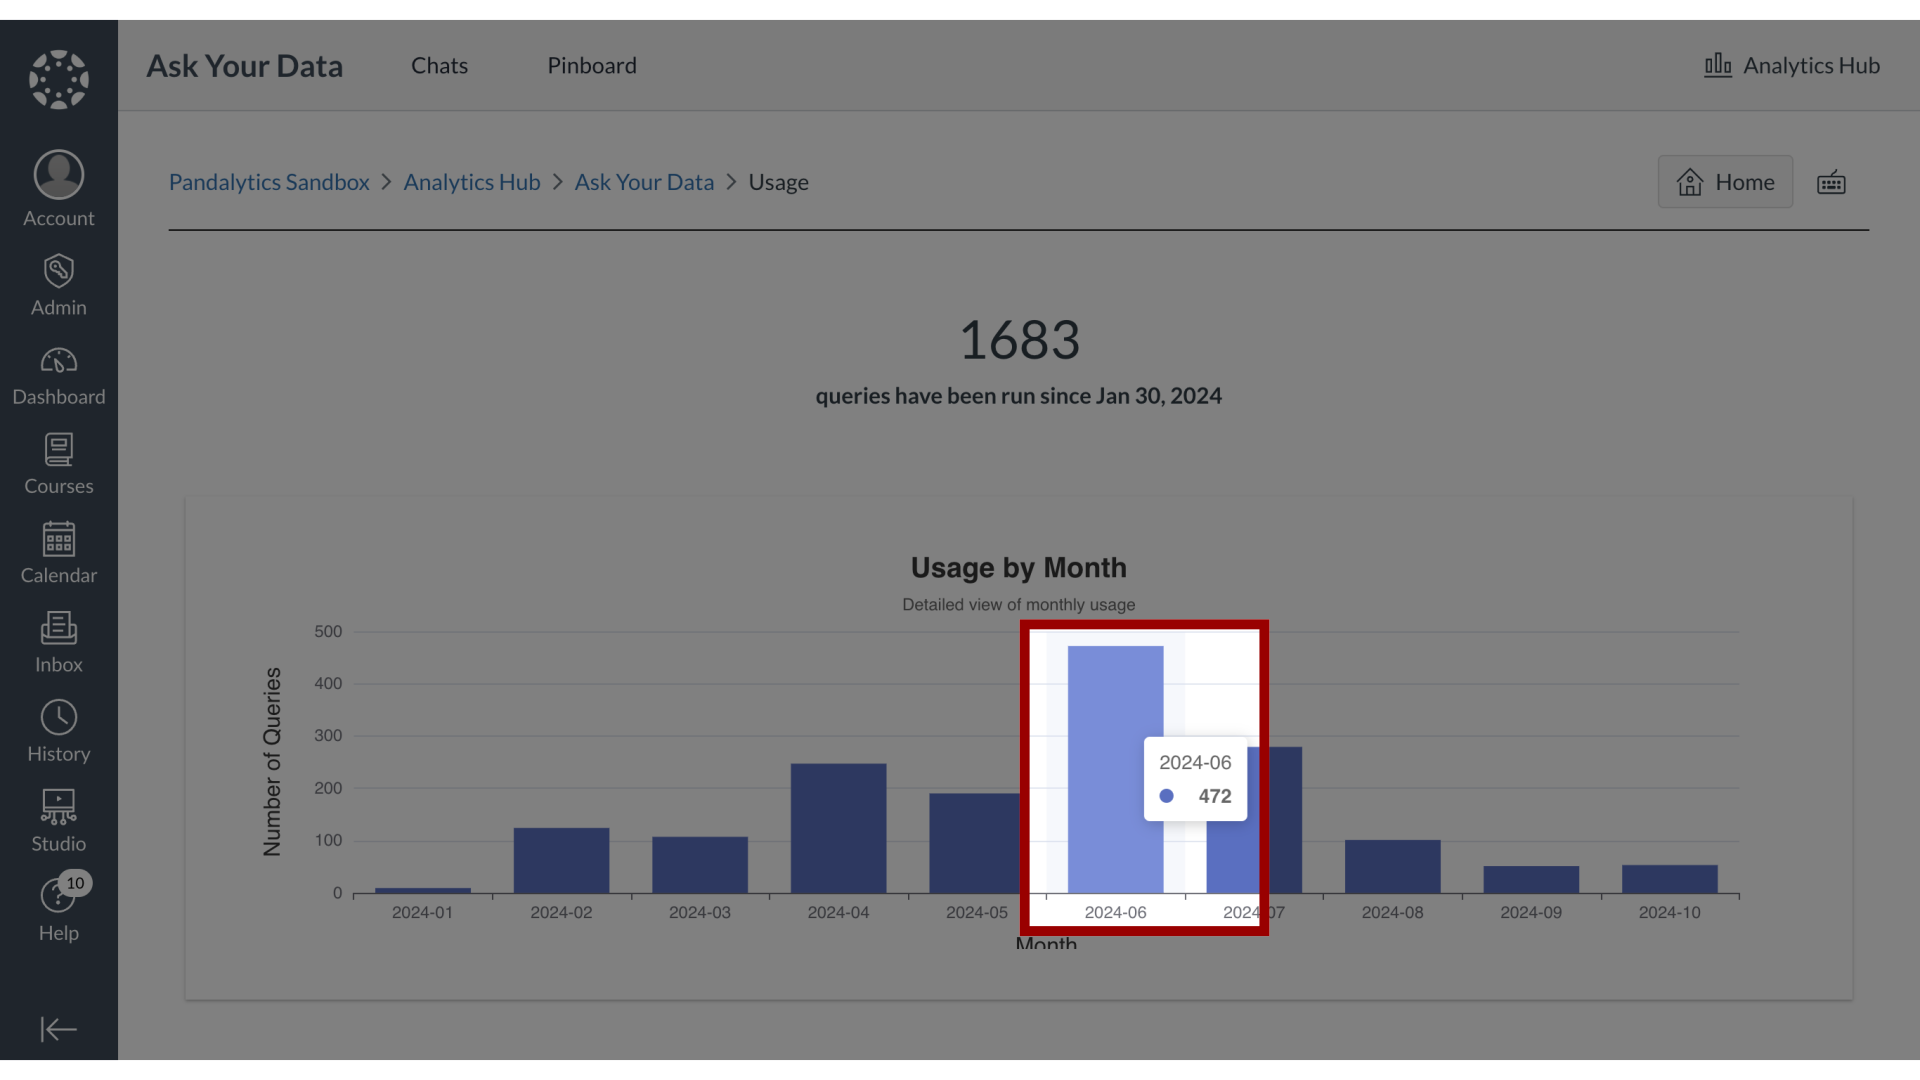
In Ask Your Data, you can gain insights into your query activity by accessing the Usage Trends dashboard. This feature allows you to see the total number of queries run since a specific date and view a chart illustrating query volumes by month. For more granular information, you can select a particular month in the chart to view its specific query details, enabling you to track your usage patterns over time.
Note: Sub-account administrators can use Ask Your Data (AYD) directly within their own sub-accounts, where AYD is scoped to display only the data relevant to that specific sub-account.